
-

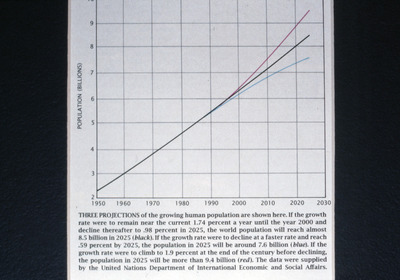
Graph, Projections of Human Population Size, September 1989
Scientific American
A line graph showing three projections of global population growth from 1950 to 2030.
-

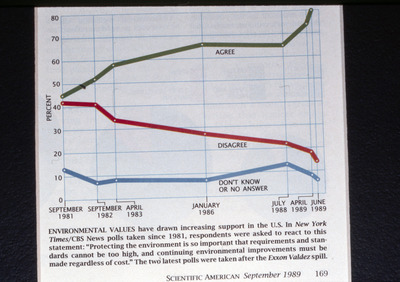
Graph, Public Opinion on Environmental Values, September 1989
Scientific American
A graph showing the results of U.S. polls from 1981 to 1989, measuring public opinion on the statement: "Protecting the environment is so important that requirements and standards cannot be too high, and continuing environmental improvements must be made regardless of cost."
-

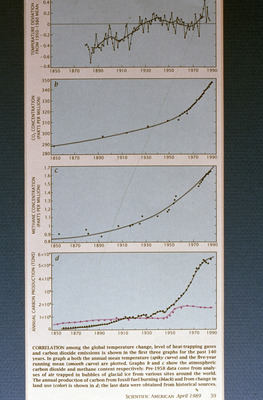
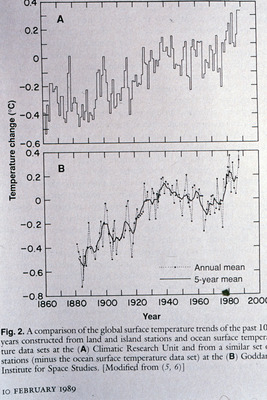
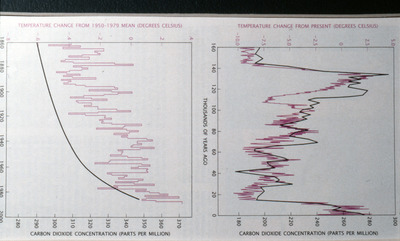
Graph, Temperature Change and Carbon Dioxide Concentration Comparison Over Time, September 1989
Scientific American
A graph comparing temperature changes in relation to carbon dioxide concentration levels.
-

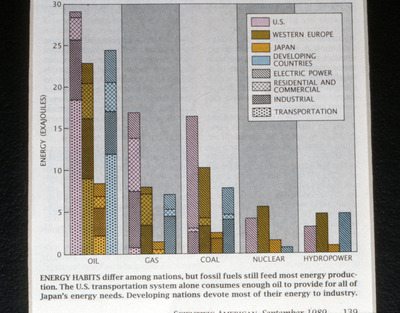
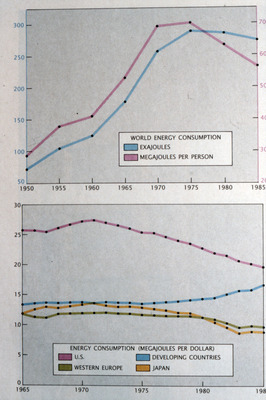
Graph, World Energy Consumption and Energy Consumption by Region, September 1989
Scientific American
A graph showing trends in world energy consumption from 1950 to 1985. The upper section displays total global energy consumption in exajoules alongside megajoules per person. The lower section compares energy consumption in megajoules per dollar across various regions, including the United States, Western Europe, Japan, and developing countries.
-

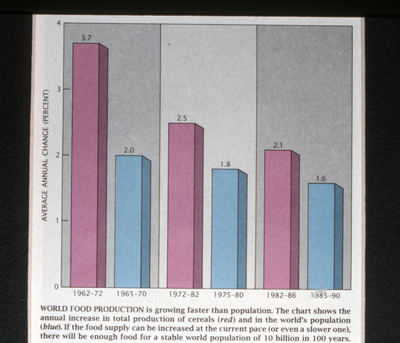
Graph, World Food Production vs. Population Growth, September 1989
Scientific American
A graph comparing the average annual percentage change in cereal production (red bars) and world population growth (blue bars) over different time periods from 1962 to 1990.
-

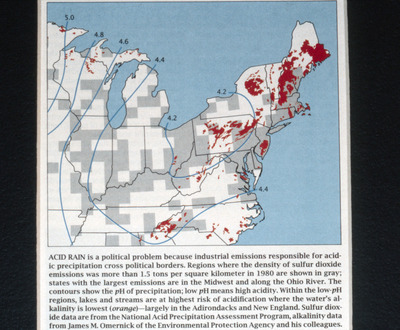
Map, Acid Rain Sulfur Dioxide Emissions and pH Levels in the Northeastern United States, September 1989
Scientific American
A map showing regions with sulfur dioxide emissions greater than 1.5 tons per square kilometer in 1980, focusing on the Midwest and areas along the Ohio River. Contours on the map indicate pH levels, where lower values represent higher acidity. The map highlights areas most affected by acid rain and the potential environmental impacts, particularly in regions like the Adirondacks and New England.
-

Map, Local Food Production and Agricultural Inputs, September 1989
Scientific American
A map illustrating global patterns of agricultural input usage and areas where local food production is outstripped by population. The map uses color coding to represent regions that employ different levels of agricultural inputs: green-revolution inputs (green), intermediate inputs (red), and low inputs (yellow).
-

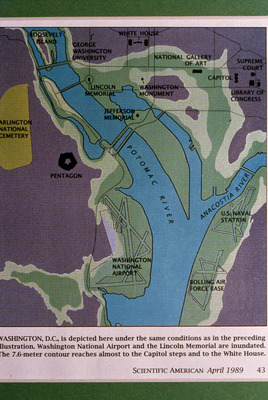
Map, Washington D.C. Flooding Scenario, April 1989
Scientific American
A map illustrating a flooding scenario in Washington D.C., showing areas inundated by a 7.6-meter contour, which includes significant landmarks such as the Lincoln Memorial, Jefferson Memorial, Pentagon, and Washington National Airport.
-

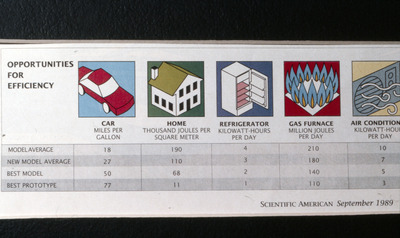
Table, Opportunities for Efficiency in Energy Consumption, September 1989
Scientific American
A table illustrating energy efficiency opportunities across five household and personal categories: car fuel efficiency (miles per gallon), home energy use (thousand joules per square meter), refrigerator power usage (kilowatt-hours per day), gas furnace energy consumption (million joules per day), and air conditioning energy use (kilowatt-hours per day). The table compares the model average, new model average, best model, and best prototype for each category, showing significant potential for improved energy efficiency in household items and transportation.
-

Graph, Distribution of Acanthaster Planci Skeletal Elements, 1989
F. Walburn
A graph displaying the distribution of Acanthaster planci skeletal elements in relation to core depth (cm) and years before present (B.P.).
-

Graph, Coral Density Across Diving Research Stations in Japan, 1988
Unknown
A graph displaying the average coral cover at various diving research stations near Okinawa, Japan, including the impact of submarine forest beds on coral density.
-

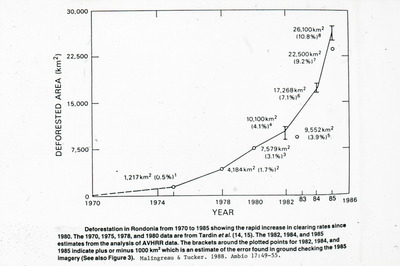
Graph, Deforestation in Rondônia from 1970 to 1985, 1988
Unknown
A graph showing the increasing rates of deforestation in Rondônia, Brazil, from 1970 to 1985.
-

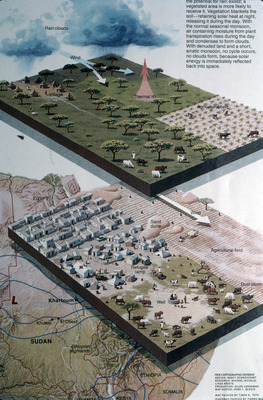
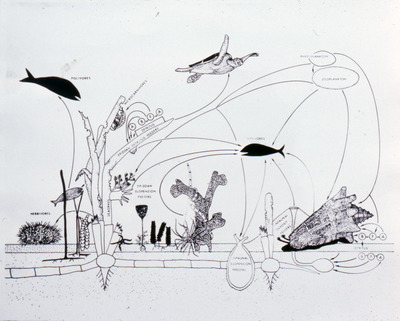
Diagram, Environmental Changes in Sudan and Ethiopia with Refugee Settlement Impact, 1987
National Geographic
A diagram depicting the environmental impact of refugee settlements and land use changes in the Sudan and Ethiopia region. The upper portion of the illustration contrasts the effects of vegetation cover on climate, showing how thermal lift and moisture retention affect rainfall patterns. The lower section illustrates the land degradation resulting from the expansion of refugee camps and agricultural activity, leading to desertification.
-

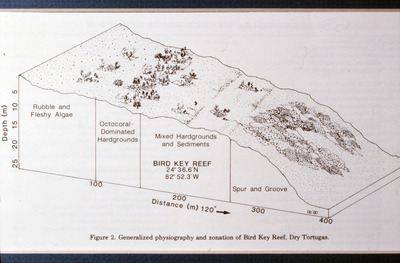
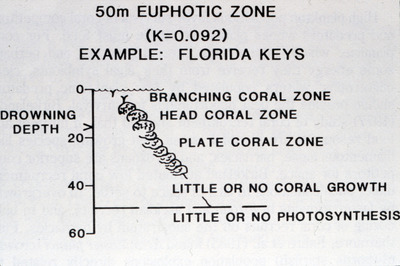
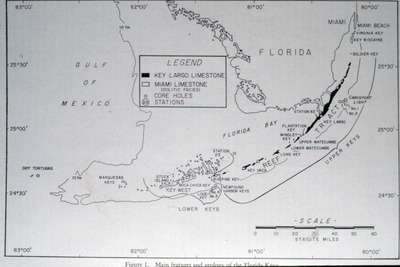
Diagram, 50m Euphotic Zone Example in Florida Keys, 1986
Fr. Muller
A diagram illustrating the different coral zones in relation to water depth within a 50-meter euphotic zone in the Florida Keys.
-

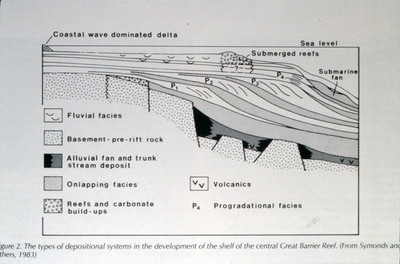
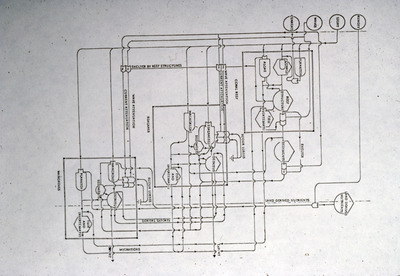
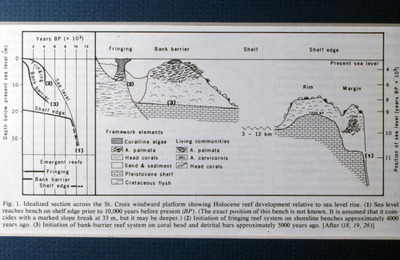
Diagram, Depositional Systems of the Central Great Barrier Reef Shelf, 1983
Unknown
A diagram illustrating various depositional systems involved in the development of the shelf of the central Great Barrier Reef.
-

Graph, Nassau Grouper Length Frequency Puerto Rico and Virgin Islands, 1985
Unknown
Graph of Nassau Grouper of Puerto Rico and the Virgin Islands for 1985, with frequency on the y axis and fork length in centimeters on the x axis. Locations include Puerto Rico, St. Thomas, and St. Croix.
-

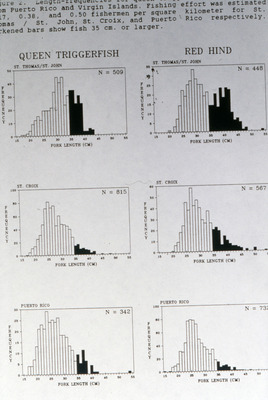
Graph, Queen Triggerfish and Red Hind Length Frequency Distribution, Undated
Unknown
A graph showing the length frequency distribution of Queen Triggerfish and Red Hind across three regions: St. Thomas/St. John, St. Croix, and Puerto Rico. The number of samples (N) varies across the regions, illustrating variations in fish size distribution, with emphasis on fish 35 cm or larger.
-

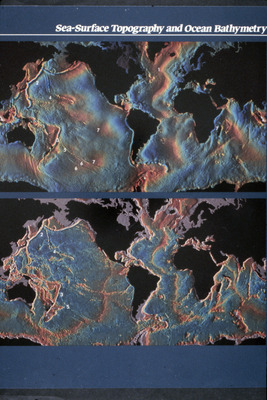
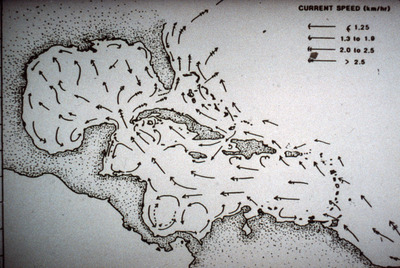
Map, Sea-Surface Topography and Ocean Bathymetry, Undated
Unknown
A view of global sea-surface topography and ocean bathymetry. The map highlights the variations in sea-surface heights and ocean floor depth features across the world's oceans, indicating ridges, trenches, and continental shelves.
-

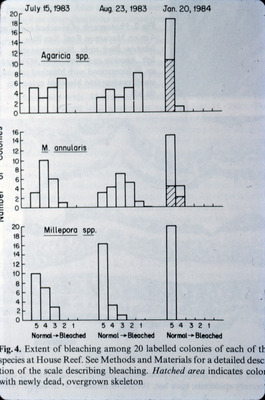
Graph, Bleaching of Reef Coelenterates in the San Blas Islands, Panama, January 20, 1984
Howard R. Lasker, Esther C. Peters, and Mary Alice Coffroth
A set of bar graphs showing the extent of coral bleaching in three species of reef coelenterates: Agaricia spp., Montastraea annularis, and Millepora spp. across three dates in 1983 and 1984. The graphs illustrate the shift from normal to bleached states in coral colonies, with a significant increase in bleaching by January 1984. Hatched sections represent areas with newly dead corals and overgrown skeletons.
-

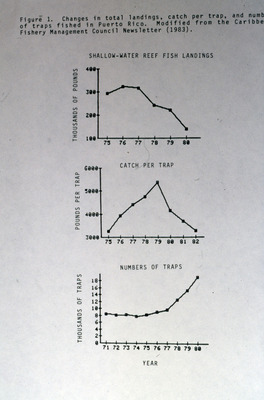
Graph, Changes in Total Landings, Catch per Trap, and Number of Traps in Puerto Rico, 1983
Caribbean Fishery Management Council
A graph illustrating the changes in shallow-water reef fish landings, catch per trap, and the number of traps used in Puerto Rico from 1971 to 1982. The data shows fluctuations in landings and catch per trap, with a notable increase in the number of traps used over time.
-

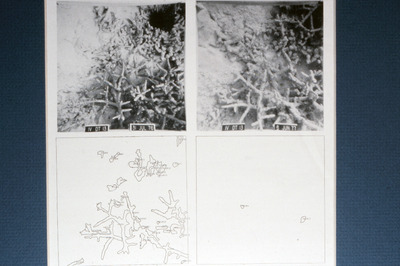
Coral after Cold Winter, Dry Tortugas, 1982
Porteir
A view of coral reefs in Dry Tortugas taken between July 31, 1976 and June 6, 1977 after a cold winter.
-

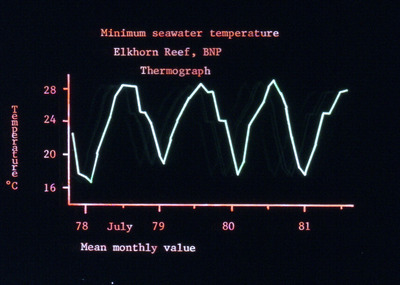
Graph, Minimum Seawater Temperature at Elkhorn Reef, Biscayne National Park, 1981
Unknown
A graph representing the minimum seawater temperature at Elkhorn Reef in Biscayne National Park from 1978 to 1981. The temperature values are shown as mean monthly values, illustrating the seasonal variations in seawater temperature over the observed period.
-

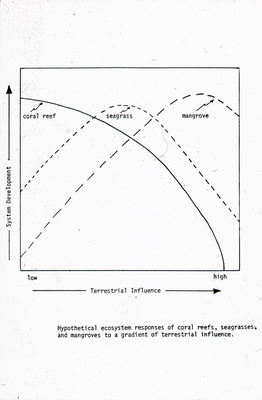
Diagram, Caribbean Coastal Seascape Showing the Relationships of Coral Reefs, Seagrasses, and Mangroves, Undated
Frank E. Muller-Karger
A diagram illustrating the relationships between different coastal ecosystems, including land, mangrove stands, seagrass beds, coral reefs, and offshore waters in the Caribbean.
-

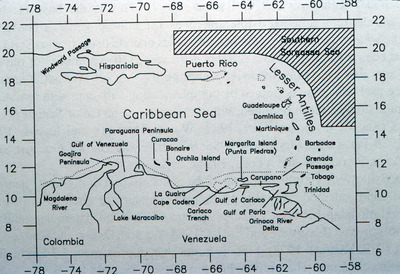
Map, Caribbean Sea and Surrounding Regions, Undated
Frank E. Muller-Karger
A map of the Caribbean Sea, highlighting key islands and coastal features of Venezuela and Colombia.
-

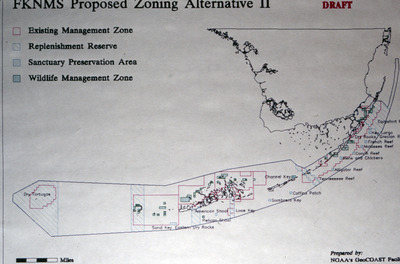
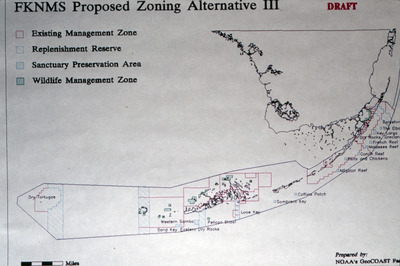
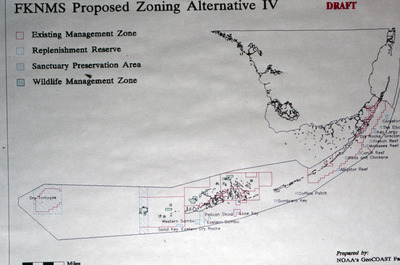
Map, Florida Keys National Marine Sanctuary Proposed Zoning Alternative II Draft, Undated
National Oceanic and Atmospheric Administration GeoCOAST Facility
Map of Florida Keys National Marine Sanctuary proposed zoning alternative II. Legend includes: existing management zone, replenishment reserve, sanctuary preservation area, and wildlife management zone.
Printing is not supported at the primary Gallery Thumbnail page. Please first navigate to a specific Image before printing.
