
-

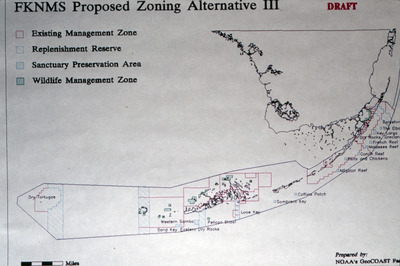
Map, Florida Keys National Marine Sanctuary Proposed Zoning Alternative III Draft, Undated
National Oceanic and Atmospheric Administration GeoCOAST Facility
Map of Florida Keys National Marine Sanctuary proposed zoning alternative III. Legend includes: existing management zone, replenishment reserve, sanctuary preservation area, and wildlife management zone.
-

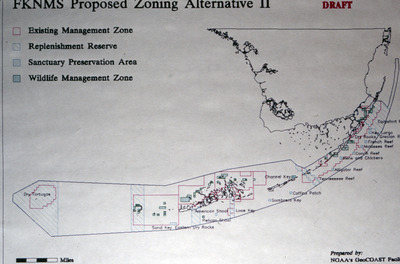
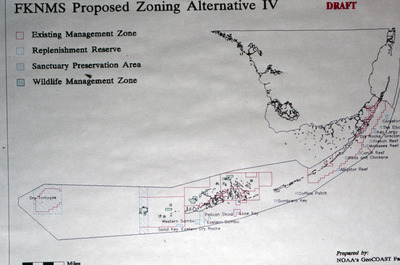
Map, Florida Keys National Marine Sanctuary Proposed Zoning Alternative IV Draft, Undated
National Oceanic and Atmospheric Administration GeoCOAST Facility
Map of Florida Keys National Marine Sanctuary proposed zoning alternative IV. Legend includes: existing management zone, replenishment reserve, sanctuary preservation area, and wildlife management zone.
-

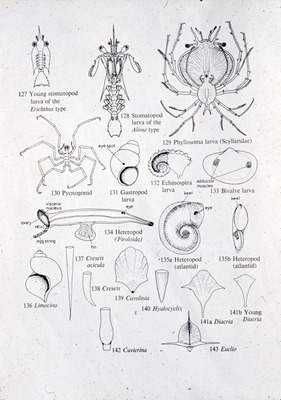
Diagram, Various Marine Larvae and Organisms Undated
John C. Ogden
A diagram showing different types of marine larvae and organisms, including young stomatopod larvae, pycnogonid, gastropod larvae, heteropod, phyllosoma larvae, echinospira larvae, bivalve larvae, and others.
-

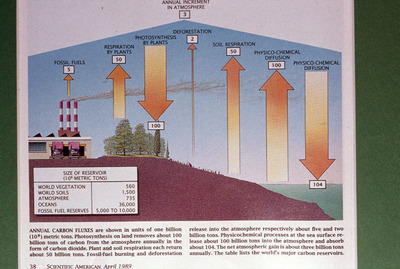
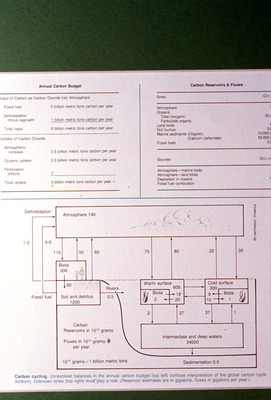
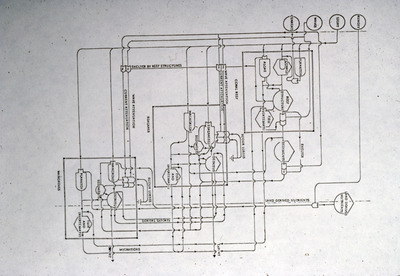
Diagram, Annual Carbon Budget, Carbon Reservoirs and Fluxes, Undated
Unknown
A diagram illustrating the annual carbon budget and the reservoirs and fluxes in the global carbon cycle. It shows inputs and outputs of carbon between the atmosphere, biota, fossil fuels, oceans, and sediments, along with fluxes of carbon in gigatons per year.
-

Diagram, Consumer Food Chain of Caribbean Seagrass, Undated
Unknown
A diagram illustrating the consumer food chain within a Caribbean seagrass ecosystem. The diagram depicts interactions between various marine organisms, including herbivores, piscivores, zooplankton, phytoplankton, and suspension feeders.
-

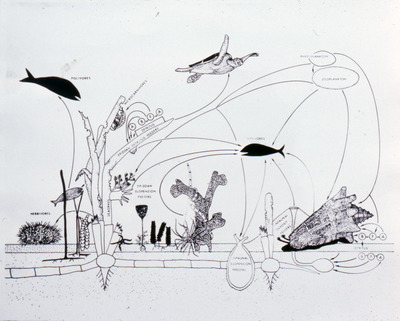
Diagram, Coral Reef Ecosystem, Undated
Unknown
A diagram illustrating the interactions and processes within a coral reef ecosystem, showing the connections between reef structures, marine species, nutrient flows, and environmental factors.
-

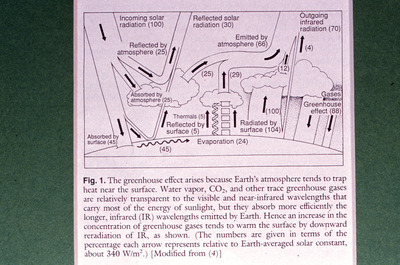
Graph, Greenhouse Effect in Earth's Atmosphere, Undated
Unknown
A graph explaining the greenhouse effect in Earth's atmosphere. It shows how solar radiation is absorbed, reflected, and emitted by both the surface and the atmosphere, with greenhouse gases trapping heat near the surface.
-

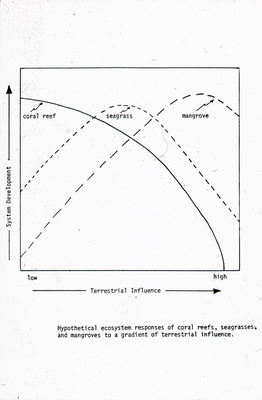
Graph, Hypothetical Ecosystem Responses of Coral Reefs, Seagrasses, and Mangroves to Terrestrial Influence, Undated
Unknown
A graph depicting the hypothetical ecosystem development responses of coral reefs, seagrasses, and mangroves along a gradient of terrestrial influence. The diagram illustrates how each system develops from low to high terrestrial influence.
-

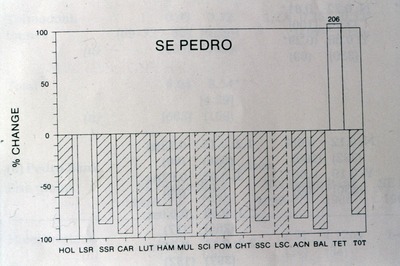
Graph, SE Pedro Percent Change, Undated
Unknown
A graph representing the percentage change in various species categories at SE Pedro.
-

Graph, Species Diversity of Coral Reef Fish, Undated
Unknown
A graph comparing the total number of species found at various global reef locations, including the Philippines, New Guinea, Great Barrier Reef, Seychelles, and Alligator Reef in Florida. The chart displays species diversity from highest to lowest across these regions.
-

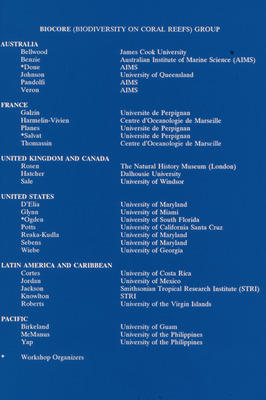
List, Members in the Biodiversity on Coral Reefs Group, Undated
Unknown
A list of researchers and their affiliated institutions from the Biocore group, focusing on biodiversity on coral reefs. The list includes members from Australia, France, United Kingdom, Canada, United States, Latin America, the Caribbean, and the Pacific regions.
-

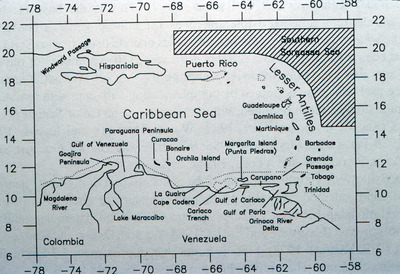
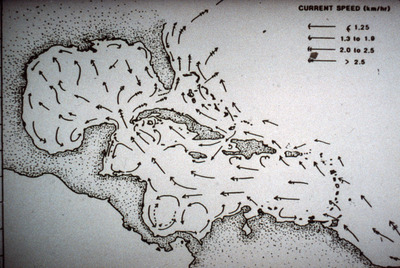
Map, Ocean Currents and Speeds in the Caribbean Region, Undated
Unknown
A diagram of current speed in the Gulf of Mexico and Atlantic Ocean, with the southern United States, Mexico, the Caribbean, and South America visible.
-

Map, Proposed Monitoring Sites in the Florida Keys and Surrounding Areas, Undated
Unknown
A map showing proposed monitoring sites throughout the Florida Keys and nearby regions, including locations such as Biscayne National Park, Key Largo, Tennessee Reef, Looe Key National Marine Sanctuary, and the Dry Tortugas.
-

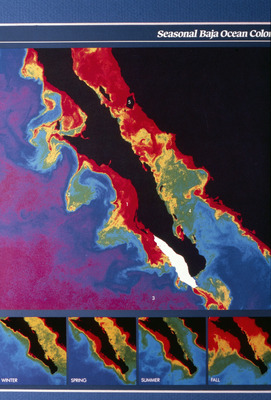
Map, Seasonal Baja Ocean Colony, Undated
Unknown
A map displaying the seasonal variations in phytoplankton colony distributions around the Baja California Peninsula. The map highlights the changes in phytoplankton colonies throughout winter, spring, summer, and fall.
-

Pie Charts, Land-Use Patterns in Denmark, Sweden, The Netherlands, United States, and Zimbabwe, Undated
Unknown
This pie chart provides a comparative analysis of land-use patterns in Denmark, Sweden, The Netherlands, the United States, and Zimbabwe. Each pie chart represents the percentage breakdown of land use in categories such as arable land, forests, pastures/grasslands, surface waters, and other land types.
-

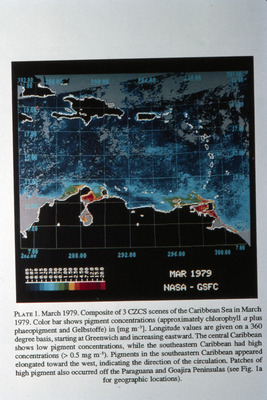
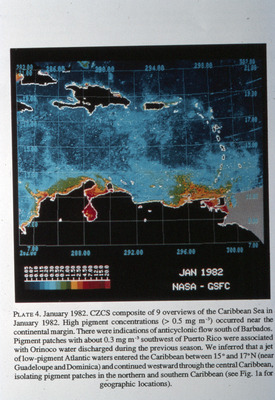
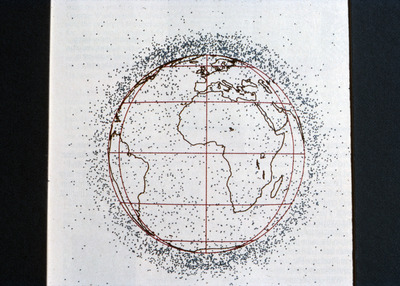
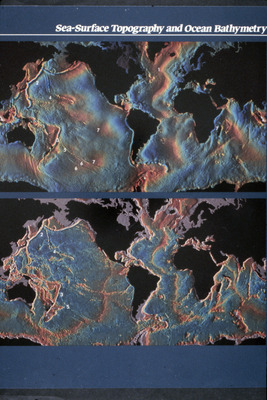
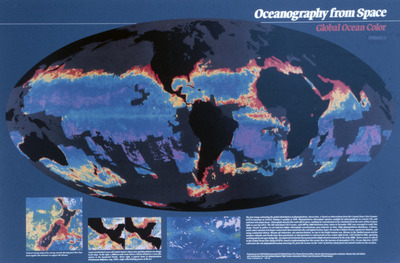
Map, Oceanography from Space, Global Ocean Color, Undated
US Global Ocean Flux Study Planning Office
A map showcasing global ocean color as observed from space. The image depicts oceanic distributions of phytoplankton, as measured by NASA's Coastal Zone Color Scanner (CZCS).
-

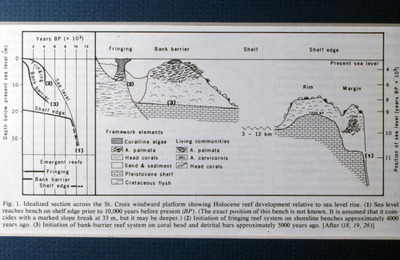
Diagram, Holocene Reef Development, St. Croix, 1978
Unknown
A cross-sectional view illustrating the Holocene reef development on the St. Croix windward platform relative to sea level rise.
-

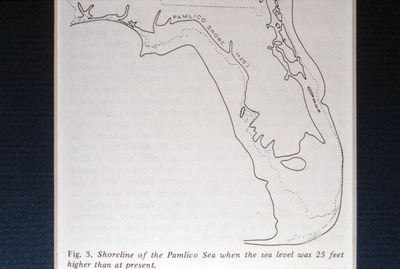
Map, Shoreline of the Pamlico Sea When Sea Level Was 25 Feet Higher Than Present, 1974
F. R. Hoffmeister
A map depicting the ancient shoreline of the Pamlico Sea, illustrating the extent of the shoreline when the sea level was approximately 25 feet higher than the current sea level.
-

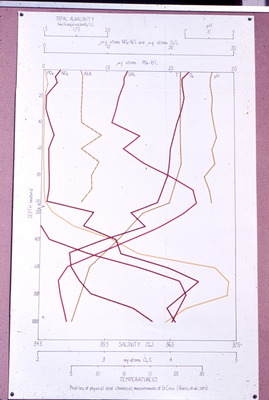
Graph, Water Chemical Analysis, St. Croix, U.S. Virgin Islands, 1974
Harry Roels
A graph illustrating the water chemical analysis of St. Croix, U.S. Virgin Islands, in 1974. The graph presents profiles of physical and chemical measurements, including salinity, temperature, alkalinity, phosphate, nitrate, oxygen, and pH at various depths.
-

Graph, Sea Level Curves Over Time for Bermuda, Mexico, and U.S. Atlantic Coast, Undated
Unknown
A graph showing sea level curves established for three regions: Bermuda, the Pacific coast of Mexico, and the U.S. Atlantic coast.
-

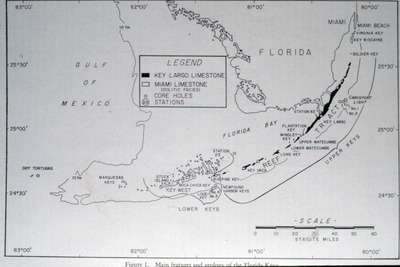
Map, Geology of the Florida Keys, 1968
J. E. Hoffmeister and H. G. Multer
A map of the main features and geology of the Florida Keys. The legend includes Key Largo limestone, Miami limestone, core holes, and stations.
-

Map, Coral Reef Zonation, North Coast of Jamaica, 1959
Ecological Society of America
A map and cross-sectional view illustrating the coral reef environments and depth zonation along the north coast of Jamaica.
Printing is not supported at the primary Gallery Thumbnail page. Please first navigate to a specific Image before printing.
