
Binder 02: Field Notes and Documents
Files
Download
Download Full Text (3.7 MB)
Publication Date
9-1989
Abstract
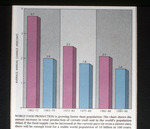
A graph comparing the average annual percentage change in cereal production (red bars) and world population growth (blue bars) over different time periods from 1962 to 1990.
Keywords
Energy, Resources, Food, Agriculture
Extent
1 graph
Physical Collection
Box
1
Folder
Binder 2
Language
English
Digital Date
2024
Media Type
Graphs
Identifier
O19-02175
Recommended Citation
Scientific American, "Graph, World Food Production vs. Population Growth, September 1989" (1989). Binder 02: Field Notes and Documents. 53.
https://digitalcommons.usf.edu/ogden2_notes/53
Rights Statement

