
Dr. Garald Gordon Parker Collection - Images
Files
Download
Download Full Text (3.7 MB)
Preview
Creation Date
1950
Time Period
circa 1950s
Abstract
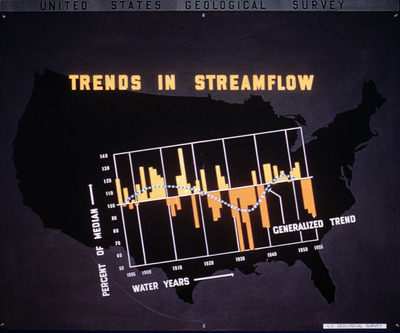
Bar graph showing streamflow trends from 1895 to 1955.
Alt Text
A map of the United States with a graph overlay showing trends in streamflow from 1920 to 1955, highlighting percent of median water levels across different years. The title "Trends in Streamflow" is prominently displayed at the top.
Keywords
Streamflow
Extent
1 bar graph
Physical Collection
Language
English
Media Type
Bar graphs
Identifier
G16-00116
Recommended Citation
Parker, Garald Gordon, "Bar Graph, Trends in Streamflow" (1950). Dr. Garald Gordon Parker Collection - Images. Image 77.
https://digitalcommons.usf.edu/parker_photographs/77
Keywords
Streamflow
Rights Statement

