
Dr. Garald Gordon Parker Collection - Images
Files
Download
Download Full Text (5.2 MB)
Preview
Creation Date
1950
Time Period
circa 1950s
Abstract
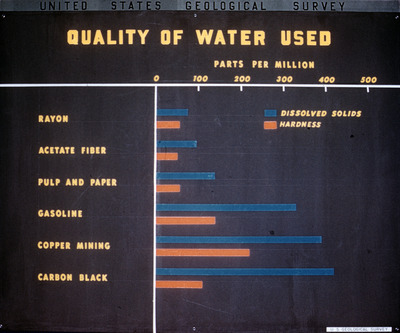
Bar graph showing water quality data for various industries.
Alt Text
A bar chart titled "Quality of Water Used" showing parts per million of dissolved solids and hardness across various industries. The chart lists categories like rayon, acetate fiber, pulp and paper, gasoline, copper mining, and carbon black with corresponding blue and orange bars.
Keywords
Trace elements in water, Hardness of water
Extent
1 bar graph
Physical Collection
Language
English
Media Type
Bar graphs
Identifier
G16-00126
Recommended Citation
Parker, Garald Gordon, "Bar Graph, Quality of Water Used" (1950). Dr. Garald Gordon Parker Collection - Images. Image 87.
https://digitalcommons.usf.edu/parker_photographs/87
Keywords
Trace elements in water, Hardness of water
Rights Statement

