
Dr. Garald Gordon Parker Collection - Images
Files
Download
Download Full Text (3.9 MB)
Preview
Creation Date
1950
Time Period
circa 1950s
Abstract
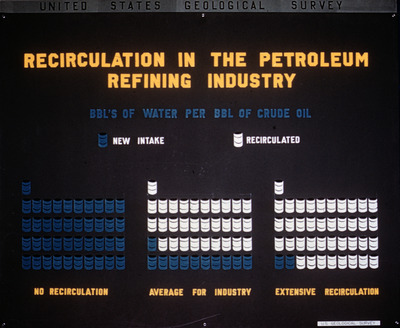
Chart with data on water use in the petroleum refining industry.
Alt Text
A chart titled "Recirculation in the Petroleum Refining Industry" showing barrels of water per barrel of crude oil with different levels of recirculation. The chart uses blue and white bars to represent new intake and recirculated water respectively.
Keywords
Petroleum refining, Water use
Extent
1 chart
Physical Collection
Language
English
Media Type
Charts (Graphic documents)
Identifier
G16-00129
Recommended Citation
Parker, Garald Gordon, "Chart, Recirculation in the Petroleum Refining Industry" (1950). Dr. Garald Gordon Parker Collection - Images. Image 90.
https://digitalcommons.usf.edu/parker_photographs/90
Keywords
Petroleum refining, Water use
Rights Statement

