
Dr. Garald Gordon Parker Collection - Images
Files
Download Full Text (6.5 MB)
Preview
Creation Date
1972
Time Period
circa 1972
Abstract
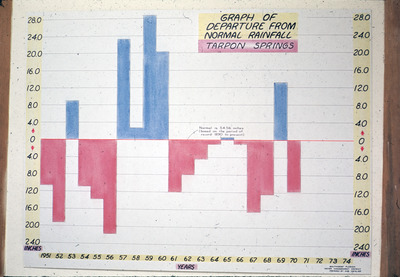
A bar graph showing the departure from normal rainfall for Tarpon Springs, Florida, from 1950 to 1972.
Alt Text
A bar graph showing rainfall departure from normal levels in Tarpon Springs over several years, with blue and red bars indicating positive and negative deviations respectively. The x-axis represents the years from 1953 to 1974, while the y-axis shows the inches of deviation.
Keywords
Rain and rainfall, Rainfall probabilities
Extent
1 bar graph
Subject: geographic
Pinellas County (Fla.); Tarpon Springs (Fla.)
Physical Collection
Language
English
Media Type
Bar graphs
Identifier
G16-00136
Recommended Citation
Parker, Garald Gordon, "Bar Graph, Departure from Normal Rainfall for Tarpon Springs" (1972). Dr. Garald Gordon Parker Collection - Images. Image 97.
https://digitalcommons.usf.edu/parker_photographs/97
Keywords
Rain and rainfall, Rainfall probabilities
Rights Statement

