
Dr. Garald Gordon Parker Collection - Images
Files
Download
Download Full Text (8.4 MB)
Preview
Creation Date
1972
Time Period
circa 1972
Abstract
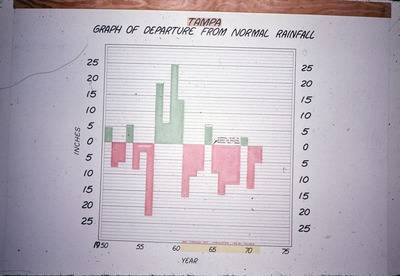
A bar graph showing the departure from normal rainfall for Tampa, Florida, from 1950 to 1972.
Alt Text
A bar graph titled "Graph of Departure from Normal Rainfall" with years on the x-axis and inches on the y-axis, showing data for Tampa. The bars are colored green and pink to represent different values.
Keywords
Rain and rainfall, Rainfall probabilities
Extent
1 bar graph
Subject: geographic
Hillsborough County (Fla.); Tampa (Fla.)
Physical Collection
Language
English
Media Type
Bar graphs
Identifier
G16-00131
Recommended Citation
Parker, Garald Gordon, "Bar Graph, Departure from Normal Rainfall for Tampa" (1972). Dr. Garald Gordon Parker Collection - Images. Image 92.
https://digitalcommons.usf.edu/parker_photographs/92
Keywords
Rain and rainfall, Rainfall probabilities
Rights Statement

