
Dr. Garald Gordon Parker Collection - Images
Files
Download
Download Full Text (4.9 MB)
Preview
Creation Date
1950
Time Period
circa 1950s
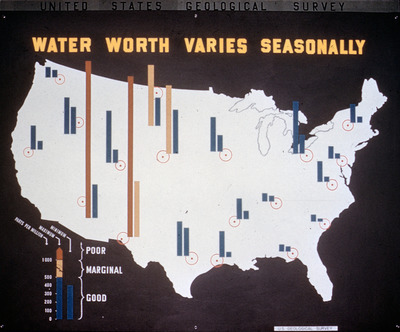
Abstract
A map showing water quality over seasons in the United States represented by bars.
Alt Text
A map of the United States showing seasonal variations in water worth with color-coded bars indicating different levels of water quality across various regions. The legend explains the color coding for poor, marginal, and good water worth.
Keywords
Water quality
Extent
1 map
Physical Collection
Language
English
Media Type
Maps
Identifier
G16-00111
Recommended Citation
Parker, Garald Gordon, "Map, Water Worth Varies Seasonally" (1950). Dr. Garald Gordon Parker Collection - Images. Image 72.
https://digitalcommons.usf.edu/parker_photographs/72
Keywords
Water quality
Rights Statement

