
Dr. Garald Gordon Parker Collection - Images
Files
Download Full Text (2.8 MB)
Preview
Creation Date
1960
Time Period
circa 1960s
Abstract
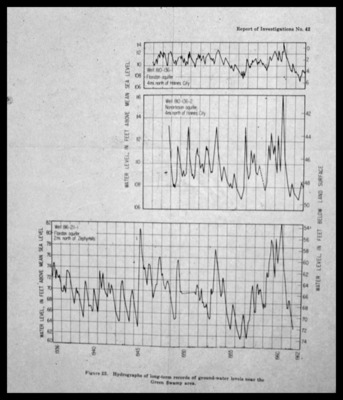
Line graphs showing hydrographs of long-term records of Groundwater levels near the Green Swamp area in West-Central Florida. The left y-axis shows water level in feet above mean sea level while the right y-axis shows water level in feet below land surface. The line graphs show data for the years 1936-1962.
Alt Text
Three line graphs displaying water level data over time, with each graph showing fluctuations and trends in the measurements. The graphs are labeled with specific details about the wells and locations being monitored.
Keywords
Geology, Hydrogeology, Groundwater, Water levels
Extent
3 line graphs
Subject: geographic
Green Swamp Wildlife Management Area (Fla.)
Physical Collection
Language
English
Media Type
Line graphs
Identifier
G16-00531
Recommended Citation
Parker, Garald Gordon, "Line Graphs, Hydrographs of Long-Term Records of Groundwater Levels near the Green Swamp Area" (1960). Dr. Garald Gordon Parker Collection - Images. Image 499.
https://digitalcommons.usf.edu/parker_photographs/499
Keywords
Geology, Hydrogeology, Groundwater, Water levels
Rights Statement

