
Dr. Garald Gordon Parker Collection - Images
Files
Download Full Text (3.0 MB)
Preview
Creation Date
1960
Time Period
circa 1960s
Abstract
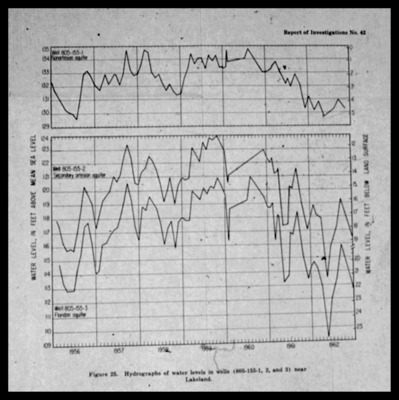
Line graphs showing hydrographs of water levels in wells near Lakeland. The left y-axis shows water level in feet above mean sea level while the right y-axis shows water level in feet below land surface. The line graphs show data for the years 1956-1962.
Alt Text
A graph showing water levels over time with two distinct lines representing different wells near Lakeland. The x-axis spans from 1954 to 1962, and the y-axis measures water level in feet above mean sea level.
Keywords
Geology, Hydrogeology, Water levels, Wells
Extent
2 line graphs
Subject: geographic
Polk County (Fla.); Lakeland (Fla.)
Physical Collection
Language
English
Media Type
Line graphs
Identifier
G16-00530
Recommended Citation
Parker, Garald Gordon, "Line Graphs, Hydrographs of Water Levels in Wells near Lakeland" (1960). Dr. Garald Gordon Parker Collection - Images. Image 498.
https://digitalcommons.usf.edu/parker_photographs/498
Keywords
Geology, Hydrogeology, Water levels, Wells
Rights Statement

