
Dr. Garald Gordon Parker Collection - Images
Files
Download
Download Full Text (1.7 MB)
Preview
Creation Date
1960
Time Period
circa 1960s
Abstract
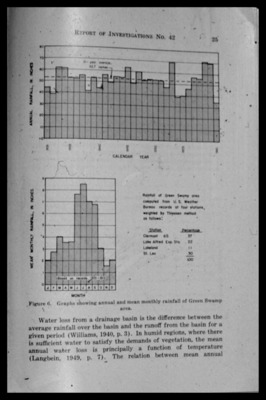
Bar graphs showing annual and mean monthly rainfall of the Green Swamp area of Florida.
Alt Text
A page from a report displaying two bar graphs with data on rainfall and water loss, accompanied by descriptive text below the graphs. The top graph shows annual and mean monthly rainfall over calendar years, while the bottom graph illustrates basin area versus water loss.
Keywords
Rain and rainfall
Extent
2 bar graphs
Subject: geographic
Green Swamp Wildlife Management Area (Fla.)
Physical Collection
Language
English
Media Type
Bar graphs
Identifier
G16-00487
Recommended Citation
Parker, Garald Gordon, "Bar Graphs, Annual and Mean Monthly Rainfall of Green Swamp Area" (1960). Dr. Garald Gordon Parker Collection - Images. Image 447.
https://digitalcommons.usf.edu/parker_photographs/447
Keywords
Rain and rainfall
Rights Statement

