
Dr. Garald Gordon Parker Collection - Images
Files
Download
Download Full Text (10.2 MB)
Preview
Creation Date
1960
Time Period
circa 1960s
Abstract
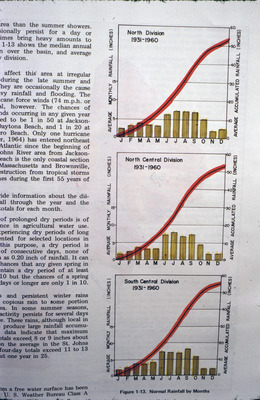
Three combination graphs showing rainfall levels in different divisions of Florida.
Alt Text
A page with graphs and bar charts showing monthly rainfall data from different divisions over a period of time, accompanied by descriptive text explaining the climate patterns. The graphs display trends in accumulated rainfall for various regions.
Keywords
Rain and rainfall
Extent
3 combination graphs
Physical Collection
Language
English
Media Type
Graphs
Identifier
G16-00140
Recommended Citation
Parker, Garald Gordon, "Combination Graphs, Rainfall in North, North Central, and South Central Divisions" (1960). Dr. Garald Gordon Parker Collection - Images. Image 101.
https://digitalcommons.usf.edu/parker_photographs/101
Keywords
Rain and rainfall
Rights Statement

