
Dr. Garald Gordon Parker Collection - Images
Files
Download Full Text (6.1 MB)
Preview
Creation Date
1970
Time Period
circa 1970s
Abstract
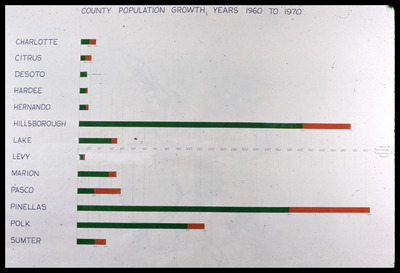
Bar graphs showing county population growth, from 1960 to 1970, for various counties in Florida
Alt Text
A bar graph displaying county population growth from 1960 to 1970, with different counties listed on the left and colored bars representing growth data. The graph includes counties Charlotte, Citrus, DeSoto, Hardee, Hernando, Hillsborough, Lake, Levy, Marion, Pasco, Pinellas, Polk, and Sumter.
Keywords
Population, Human populations estimates
Extent
1 bar graph
Subject: geographic
Charlotte County (Fla.); Citrus County (Fla.); De Soto County (Fla.); Hardee County (Fla.); Hernando County (Fla.); Hillsborough County (Fla.); Lake County (Fla.); Levy County (Fla.); Marion County (Fla.); Pasco County (Fla.); Pinellas County (Fla.); Polk County (Fla.); Sumter County (Fla.)
Physical Collection
Language
English
Media Type
Bar graphs
Identifier
G16-00478
Recommended Citation
Parker, Garald Gordon, "Bar Graph, County Population Growth, Years 1960 to 1970" (1970). Dr. Garald Gordon Parker Collection - Images. Image 438.
https://digitalcommons.usf.edu/parker_photographs/438
Keywords
Population, Human populations estimates
Rights Statement

