
Binder 02: Field Notes and Documents
Files
Download Full Text (3.8 MB)
Publication Date
4-1989
Abstract
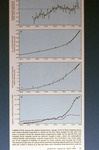
A graph illustrates the correlation between global temperature changes, atmospheric concentrations of carbon dioxide and methane, and annual carbon production from 1850 to 1990. Four subgraphs depict the temperature deviation from the 1950–1980 mean, CO2 and methane concentration trends, and the increase in carbon production due to fossil fuel burning and land-use changes over time.
Keywords
Weather, Temperature, Climate, Climate change
Extent
1 graph
Physical Collection
Box
1
Folder
Binder 2
Language
English
Digital Date
2024
Media Type
Graphs
Identifier
O19-02164
Recommended Citation
Scientific American, "Graph, Correlation Between Global Temperature, Greenhouse Gases, and Carbon Production, April 1989" (1989). Binder 02: Field Notes and Documents. 46.
https://digitalcommons.usf.edu/ogden2_notes/46
Rights Statement

