
Dr. Garald Gordon Parker Collection - Images
Files
Download
Download Full Text (4.1 MB)
Preview
Creation Date
1950
Time Period
circa 1950s
Abstract
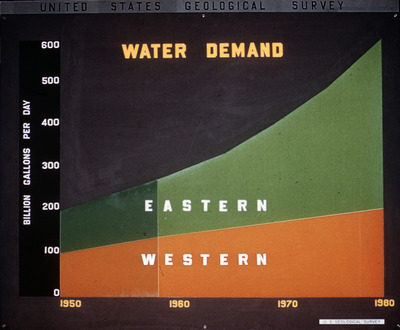
Line graph showing water demand in billion gallons per day from 1950 to 1980.
Alt Text
A graph titled "Water Demand" showing water usage in billion gallons per day from 1950 to 1980, divided into Eastern and Western regions. The graph uses different colors to represent the two regions over time.
Keywords
Water demand management
Extent
1 line graph
Physical Collection
Language
English
Media Type
Line graphs
Identifier
G16-00110
Recommended Citation
Parker, Garald Gordon, "Line Graph, Water Demand" (1950). Dr. Garald Gordon Parker Collection - Images. Image 71.
https://digitalcommons.usf.edu/parker_photographs/71
Keywords
Water demand management
Rights Statement

