
Dr. Garald Gordon Parker Collection - Images
Files
Download
Download Full Text (2.6 MB)
Preview
Creation Date
1970
Time Period
circa 1970s
Abstract
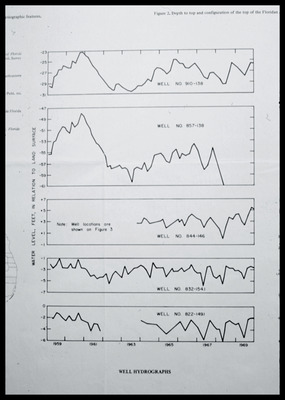
A series of four line graphs showing well hydrographs with water levels shown in feet in relation to land surface, for the years 1959 to 1969.
Alt Text
A black-and-white graph showing water level measurements from different wells over time, with each well's data displayed in a separate line plot. The x-axis represents years from 1959 to 1968, while the y-axis indicates water levels in feet below land surface.
Keywords
Geology, Hydrogeology, Water levels
Extent
4 line graphs
Physical Collection
Language
English
Media Type
Line graphs
Identifier
G16-00519
Recommended Citation
Parker, Garald Gordon, "Line Graphs, Hydrographs" (1970). Dr. Garald Gordon Parker Collection - Images. Image 487.
https://digitalcommons.usf.edu/parker_photographs/487
Keywords
Geology, Hydrogeology, Water levels
Rights Statement

