
Dr. Garald Gordon Parker Collection - Images
Files
Download Full Text (8.4 MB)
Preview
Creation Date
1970
Time Period
circa 1970-1987
Abstract
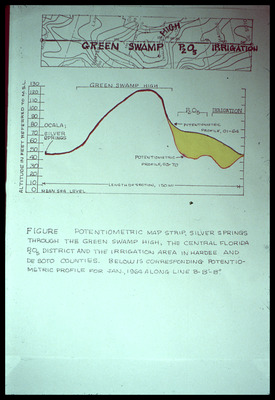
Line graph showing potentiometric map strip of Silver Springs and Green Swamp for January 1964, with altitude in feet referred to MSL (Mean Sea Level)
Alt Text
A scientific diagram showing a potentiometric map strip and profile of the Green Swamp High area. The graph displays altitude in feet above mean sea level against distance in feet.
Keywords
Geology, Potentiometry
Extent
1 line graph
Subject: geographic
Marion County (Fla.); Silver Springs (Fla.); Green Swamp Wildlife Management Area (Fla.)
Physical Collection
Language
English
Media Type
Line graphs
Identifier
G16-00458
Recommended Citation
Parker, Garald Gordon, "Line Graph, Potentiometric Map Strip, Silver Springs through the Green Swamp High, the Central Florida P2O5 District and the Irrigation Area in Hardee and De Soto Counties with Potentiometric Profile 05-70" (1970). Dr. Garald Gordon Parker Collection - Images. Image 418.
https://digitalcommons.usf.edu/parker_photographs/418
Keywords
Geology, Potentiometry
Rights Statement

