
Dr. Garald Gordon Parker Collection - Images
Files
Download Full Text (4.8 MB)
Preview
Creation Date
2-12-1978
Abstract
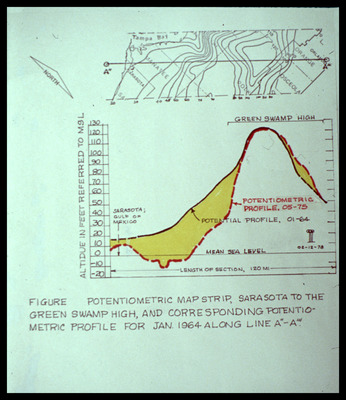
Line graph showing potentiometric map strip of Sarasota to the Green Swamp for January 1964, with altitude in feet referred to MSL (Mean Sea Level)
Alt Text
A map and graph showing potentiometric profiles related to the Green Swamp High area, with labels indicating altitudes and locations. The image includes a detailed contour map at the top and a line graph below it.
Keywords
Potentiometry, Water levels
Extent
1 line graph
Subject: geographic
Sarasota County (Fla.); Sarasota (Fla.); Green Swamp Wildlife Management Area (Fla.)
Physical Collection
Language
English
Media Type
Line graphs
Identifier
G16-00455
Recommended Citation
Parker, Garald Gordon, "Line Graph, Potentiometric Map Strip, Sarasota to the Green Swamp High, and Corresponding Potentiometric Profile for January 1964 Along Line A-A with Potentiometric Profile 05-75" (1978). Dr. Garald Gordon Parker Collection - Images. Image 415.
https://digitalcommons.usf.edu/parker_photographs/415
Keywords
Potentiometry, Water levels
Rights Statement

