
Binder 19: Photographs and Images
Files
Download Full Text (4.3 MB)
Preview
Creation Date
8-24-1992
Abstract
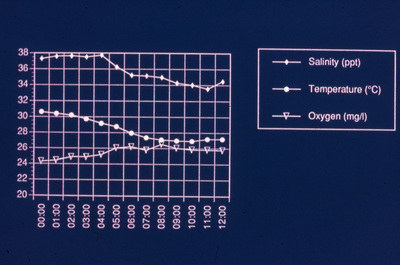
Data from Ceasar’s Creek in Biscayne National Park during Hurricane Andrew: seawater salinity, temperature, and dissolved oxygen (use -20 for oxygen scale: 4 mg/1 represented on graph as 24 mg/1). Data from Hydrolabs deployed by Biscayne National Park.
Alt Text
A line graph displaying three data series over an unknown period, ranging from 00:00 to 12:00, with labels indicating salinity, temperature, and oxygen levels. The x-axis represents time, while the y-axis shows measurement values for each parameter.
Keywords
Hurricanes, Hurricane Andrew (1992), Extreme weather, Natural disasters, Hurricane damage
Extent
1 page of graphs
Physical Collection
Box
7
Folder
Binder 19
Language
English
Digital Date
2024
Media Type
Graphs
Identifier
O19-02880
Recommended Citation
Porter, James W., "Graphs, Hurricane Andrew Data, Caesar Creek, 1992" (1992). Binder 19: Photographs and Images. Image 61.
https://digitalcommons.usf.edu/ogden19_images/61
Keywords
Hurricanes, Hurricane Andrew (1992), Extreme weather, Natural disasters, Hurricane damage
Image Location
Latitude
25.38987373
Longitude
-80.22958123
Rights Statement

